Analysis Data
Click on the ‘Browse Pathways’ button on the Homepage. In the next page, click the ‘Analysis’ button on the top right:

Alternatively, select the ‘Analyze Data’ button on the Homepage:

This opens a submission form, where you can select the analysis you want to perform, paste in or browse to a file containing your data, or use an example data set.

There are two sections to the submission form. The ‘Analyse your data’ section is selected by default to submit your data. Several different analyses can be performed, depending on the format of your data.
If your data is a single column of identifiers such as UniProt IDs, gene symbols or ChEBI IDs, they are mapped to pathways and over-representation and pathway-topology analyses are run. Over-representation analysis is a statistical (hypergeometric distribution) test that determines whether certain Reactome pathways are over-represented (enriched) in the submitted data. It answers the question ‘Does my list contain more proteins for pathway X than would be expected by chance?’ This test produces a probability score, which is corrected for false discovery rate using the Benjamani-Hochberg method.
Pathway topology analysis considers the connectivity between molecules that is represented by the pathway steps (which we refer to as reactions) in the pathway. It groups all the molecules represented in each reaction as a pathway ‘unit’. If any of these molecules are represented in your query set, this is considered a match to that reaction. This may give a better indication of the proportion of the pathway that matches your data, rather than the number of molecules that are common between your data and the pathway. It may also indicate that your data matches the start, end or a particular branch of a pathway process. This test does not have a probability score.
If your data has one or more additional columns of numbers it will be recognized as expression data and expression data overlay will be performed. Note that this data format should include a header row. The first column header should start with the # symbol. The numbers are used to produce a scaled coloured overlay over Reactome pathway diagrams, as a means to visualize relative expression levels. Note that the numeric values do not have to be expression data, for instance by using gene association scores the same analysis can be used to visualize genotyping results.
Identifier mapping
The submission process recognizes many types of identifiers. As part of the pre-analysis, they are mapped to Reactome molecules. The ideal identifiers to use are UniProt IDs for proteins, ChEBI IDs for small molecules, and either HGNC gene symbols or ENSEMBL IDs for DNA/RNA molecules, as these are our main external reference sources for proteins and small molecules. Many other identifiers are recognized and mapped to appropriate Reactome molecules. Accepted identifiers include HUGO gene symbols, GenBank/EMBL/DDBJ, RefPep, RefSeq, EntrezGene, MIM, InterPro, EnsEMBL protein, EnsEMBL gene, EnsEMBL transcript, and some Affymetrix and Agilent probe IDs. UniProt isoforms may be specified using the format P12345-2. If the -n suffix is omitted, this canonical form and all isoforms of it will be matched. Mixed identifier lists (different protein identifiers or protein/gene identifiers) may be used. Identifiers must be one per line. Protein-specific identifiers will typically map to protein entities, while gene-specific identifiers will map to the gene, transcript and derived proteins. If desired results can be filtered to show protein-specific or gene/transcript-specific results, details below.
Below is an example of the identifiers-only format:
Click the Continue button. A second options selection page appears:

Project to human is checked by default. With this option selected, all non-human identifiers in your query are converted by the analysis service to their human equivalents. In general, this maximizes the chances of a successful match to Reactome’s curated human pathways. However, if you want to use non-human identifiers and match these to our computationally-inferred non-human pathways, uncheck the box. You may also choose to uncheck this box if your query consists of a mixture of human and microbial identifiers and your goal is to find pathways that represent the processes of infection.
‘Include Interactors’ is unchecked by default. With this box unchecked, your query will consider only Reactome pathways. If you choose to check the box, your query will consider Reactome pathways that have been expanded by including all available protein-protein interactors from the IntAct database. This greatly increases the size of Reactome pathways, which maximizes the chances of matching your submitted identifiers to the expanded pathway, but will include interactors that have not undergone manual curation by Reactome and may include interactors that have no biological significance, or unexplained relevance. In practice it is preferable to query with ‘Include Interactors’ unchecked in the first instance, followed by a repeated query with ‘Include interactors’ selected, if a substantial proportion of the submitted identifiers do not match a Reactome pathway, to see if they can be identified as interactors.
Results for Identifier lists without associated numeric values
If you submit a single column of protein or small molecule identifiers they are mapped to pathways and over-representation and pathway-topology analyses are performed. The results will resemble the example below.

Analysis results are shown in the Analysis tab, within the Details Panel. All Reactome pathways are shown, in blocks of 20 pathways, ranked by the p-value obtained from over-representation analysis. If multiple pathways have the same p-value, they are ranked by the number of identifiers in the query that match the pathway. The number of molecules matched/total number of molecules and FDR values are added to the right side of pathway names in the Hierarchy Panel. The names of reactions that match at least one identifier in the query, representing positive pathway topology analysis hits, are boxed in orange.
In the Analysis tab, clicking on the name of a pathway will select it in the Hierarchy, which if necessary will expand hidden hierarchical levels to show the pathway, while the name becomes highlighted in dark blue.
By default, molecules of all types (protein, small molecules, genes, transcripts) are used for over-representation analysis, but it is possible to restrict the analysis results to a specific subtype by using a drop-down list located top-left of the results table. Selecting one of the subsets will display results that consider only the selected molecular subtype.
![]()
The columns in analysis details represent:
- Pathway name: Click the name to open the pathway.
- Entities found: the number of curated molecules of the type selected with Results Type that are common between the submitted data set and the pathway named in column 1. Click on this number to display the matched submitted identifiers and their mapping to Reactome molecules.
- Entities total: The total number of curated molecules of the type selected with Results Type within the pathway named in column 1.
- Interactors found (if this option was selected). The number of interactor molecules of the type selected with Results Type that are common between the submitted data set and the pathway named in column 1. Click on this number to display the matched submitted identifiers and their mapping to Reactome molecules.
- Interactors total (if this option was selected): The total number of interactor molecules of the type selected with Results Type within the pathway named in column 1.
- Entities ratio: Put simply, the proportion of Reactome pathway molecules represented by this pathway. Calculated as the ratio of entities from this pathway that are molecules of the type selected with Results Type Vs. all entities of the type selected with Results Type.
- Entities pvalue: The result of the statistical test for over-representation, for molecules of the results type selected.
- Entities FDR: False discovery rate. Corrected over-representation probability.
- Reactions found: The number of reactions in the pathway that are represented by at least one molecule in the submitted data set, for the molecule type selected with Results Type.
- Reactions Total: The number of reactions in the pathway that contain molecules of the type selected with Results Type.
- Reactions ratio: Put simply, the proportion of Reactome reactions represented by this pathway. Calculated as the ratio of reactions from this pathway that contain molecules of the type selected with Results Type Vs. all Reactome reactions that contain molecules of the type selected with Results Type.
- Species Name.
When an analysis has run, the Pathway Browser will display the Pathway Overview. All pathways that contain identifiers from your submitted list are highlighted, using a coloured scale to indicate the corrected probability (FDR). The colour scheme can be changed using the colour profiles tab (artists easel icon) on the pop-out Settings panel, found on the right-hand edge of the pathway panel. Selecting coverage in the Overexpression panel will alter the Pathway Overview display to show additional event crosslinks corresponding to areas that are heavily covered vs regions that have lower coverage (as shown in the pValue view), and making it easier to visualize the pathways enriched within your dataset.
The highlighting of pathways in the Overview provides an at-a-glance representation of analysis results for all pathways. To see the details of a specific pathway, double-click the node representing the pathway in the overview or in the Pathway Hierarchy on the left. Alternatively, click it once to select it and use the Show All button (square with outward pointing triangles inside) in the top left corner of the Overview panel. The Overview can be navigated using the mouse scroll wheel to zoom in and out and click and drag to move it around. Alternatively, use the navigation buttons in the bottom right corner of the overview panel. At any level of the pathway, the diagram key can be found by clicking the compass symbol in the top right corner.

Enhanced high-level diagrams represent analysis results within the label for subpathways. The label background changes from blue to white, a yellow band is used to indicate the proportion of the pathway that is represented in the query dataset. A grey bar above the label indicates the number of pathway entities that are represented in the query dataset, the total number of entities in the pathway, and the FDR corrected probability score

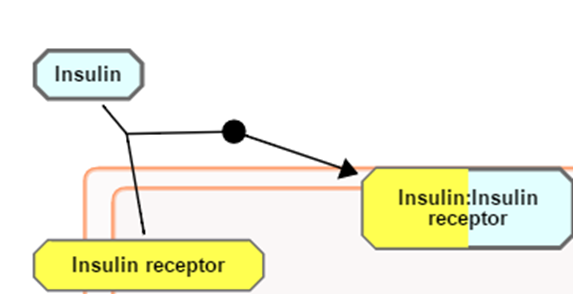
In Pathway Diagrams, entities are re-coloured (yellow in the default colour scheme) if they were represented in the submitted data set. Complexes, Sets and Subpathway Icons are coloured to represent the proportion that is represented in the submitted identifier list. In the figure below, Insulin receptor is yellow indicating that is was in the submitted list. Insulin was not in the submitted list so it is not re-coloured. The complex of insulin:Insulin receptor is part re-coloured, part not, indicating that some molecules in the complex were represented in the submitted dataset while others were not.
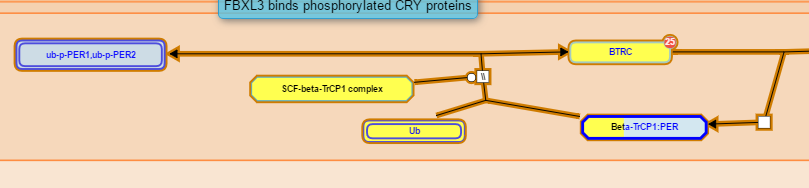
If the Include Interactors option was checked, entities with interactors that were part of the submitted identifier list have a ribbon across the top right corner. In the example below, RASA1 is not a direct match with the submitted list of identifiers but has interactors that match the list. The interactors are displayed; the yellow overlay indicates the matching interactors. PTPN11 is a direct match and has interactors that match the list. A limited number of interactors are displayed to avoid crowding.

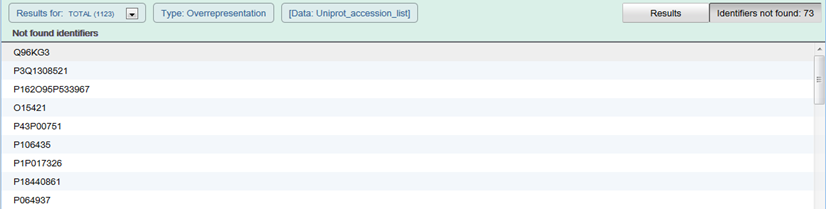
At the right side of the Analysis results details is a button indicating the number of submitted identifiers that were not successfully matched to molecules in Reactome. Click the button to produce a list.
Results for Identifier lists with associated numeric values (expression representation)
To run expression analysis, submit your data in a format that includes a first row of column headers. The header for column 1 must start with the # symbol. The first column must contain protein, compound or other suitable identifiers, such as probe IDs. All other columns must be numeric values, with no alphabetical characters. The analysis tool will interpret your data as expression data. The numeric values are used to colour objects in pathway diagrams. This view was created for microarray data, but any dataset that consists of a list of identifiers with associated numeric values can be used, e.g. quantitative proteomics, GWAS scores.
The tool is launched using the Analyse data button in the Pathway Browser header bar. Either paste your data into the submission form or browse to a saved file (or select an example file).
The figure below shows the correct data format. Each row must have an identifier in the first column (a header row is optional).
The submission process recognized many types of identifiers. As part of the pre-analysis, they are mapped to equivalent UniProt accessions or for small compounds to ChEBI IDs. These are the ideal identifiers to use with Reactome analysis tools. Other identifiers that are recognized and converted to UniProt equivalents include HUGO gene symbols, GenBank/EMBL/DDBJ, RefPep, RefSeq, EntrezGene, MIM and InterPro IDs, some Affymetrix and Agilent probe IDs, Ensembl protein, transcript and gene identifiers. Identifiers that contain only numbers such as those from OMIM and EntrezGene must be prefixed by the source database name and a colon e.g. MIM:602544, EntrezGene:55718. Mixed identifier lists (different protein identifiers or protein/gene identifiers) may be used. Identifiers must be one per line.
By default, all non-human identifiers are mapped to their human equivalents, unless the Project to the human checkbox is unselected.
After column 1, all other columns must contain numbers, representing expression or other values. Comma-separated values(CSV) and tab separated value (TSV) files can be used. When submitted, columns of numbers are considered as separate samples or experimental conditions. The values are used to overlay colour onto pathway diagrams. An Experiment Browser tool allows you to select and view-overlays for each submitted data column. This tool is the panel that appears in the bottom-centre of both the pathways overview and the diagram viewer when expression data columns have been submitted. In that panel, the user can move through the different time series (and also play it as a "movie"). This is particularly useful for visualizing time-points or a disease progression.

The results may take a few seconds to appear.
The results page is very similar to that seen following submission of a simple one-column list of identifiers, with extra columns in the Analysis details following column 9. These extra columns represent the submitted expression values.
Clicking on a pathway name launches the Pathway Browser and displays the relevant Pathway Diagram (see example below).
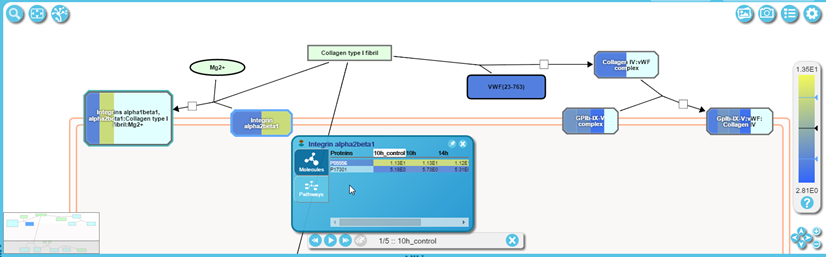
Objects in the Pathway Diagram are re-coloured according to the numeric values submitted. The colours are based on a scale as represented in a bar on the right-hand side. There are several colour schemes, selected using the Settings pop-out panel on the right side. The scale (on the right side) automatically adjusts to fit the range of values in the dataset.
Objects that were not represented in the input data are not re-coloured.
Objects with bands of colour represent complexes or sets containing more than one molecule. When zoomed out, the colour of the band reflects the average of the values submitted, for molecules represented in the dataset. The size of the band reflects the proportion of molecules that had submitted values. Zoom in to see individual bands, for each molecule that had a submitted value, arranged alphabetically by name. The bands of colour now reflect the values submitted. If multiple columns of values were submitted, representing multiple samples, e.g. time-points or a disease progression, the order of the bands will be the same for each sample.
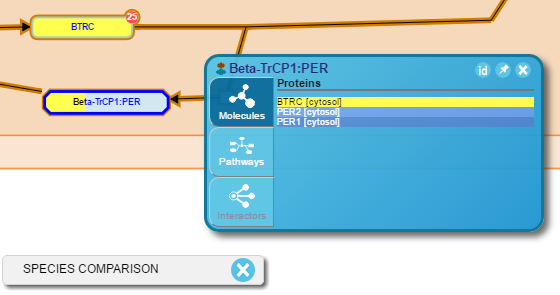
To view details of the components of a complex or set right click it. This opens a Contextual Information Panel (CIP) (see figure above). This has two tabs - Molecules and Pathways. Molecules show the participating molecules, and if an expression analysis has been performed, their expression values. Pathways identify whether the selected object is present in any other Reactome pathways, with links to the appropriate Pathway Diagrams.
Multiple CIPs can be opened and pinned so they remain visible when other entities are selected.
The browser remembers CIPs that were pinned on the last visit (for up to 5 diagrams).
The orange Experiment Browser toolbar (bottom left in the figure above) is used to step through the columns of your data, e.g. time-points or disease progression. Move between them by clicking the arrow buttons. The header of the data column (if present) is displayed between the arrows. The Pathway Diagram will re-colour to reflect the new values.
For an explanation of the results seen in the Identifier results tab see the explanation in the section Results for Identifier lists without associated numeric values.
Analysis Token
Once the analysis is finished, this data structure can also be serialised to a bin file to persist the result. In addition, associating the file to a token provides an easy way to access the data.You can keep the token once the initial analysis is finished and the results are only temporarily available for 7 days unless you re-perform your analysis with the same data. However, the analysis results will disappear after each quarterly update of the Reactome data. At this time, analysis result links and tokens will no longer work anymore duo to the data update, we recommend you to save the analysis results report(PDF) for future use.
Analysis Report
For some of our users, it might be important to preserve a pathway analysis for the long-term. Following the pathway analysis, the results can be downloaded as an easy-to-read PDF report by clicking the ‘Report (PDF)’ button located at the bottom left corner of the Details panel. The first page of the PDF report will look something like this:

The sections of the analysis report represent:
- Introduction: An overview of the Reactome project and the Analysis tool.
- Properties: A summary details of the analysis output. For example, the number of identifiers that were found in Reactome.
- Genome-wide overview: A genome-wide overview of the results of your pathway analysis.
- Most significant pathways: A table of the top 25 pathway hits. Results are ranked based upon the most significant FDR value. The embedded links within the pathway name of the table will connect to the Pathway details (Section #5).
- Pathway details: A summary view of each pathway hit. The pathway identifier in parenthesis when clicked will connect with the Pathway details page on the Reactome website. A pathway diagram, pathway summation, edit history, list of identifiers found, and references (when available) are also provided.
- Identifiers found: A table of the synonyms or identifiers that were found in Reactome based upon the input list.
- Identifiers not found: A table of the synonyms or identifiers that were not found in Reactome based upon the input list.
Analysis Gene Expression
ReactomeGSA is a new pathway analysis tool integrated into the Reactome ecosystem. Its main feature is that it performs quantitative pathway analyses (so-called gene set analyses). This increases the statistical power of the differential expression analysis, which is directly performed on the pathway level. More information click here.
Species Comparison
The manually-curated human pathways in Reactome are used to predict equivalent pathways in 18 other species. This automated, computational process is based on orthology. A full description of the inference process can be found on the Home page under Documentation, Orthology Prediction.
The Species Comparison tool allows you to compare human pathways with computationally-predicted pathways in model organisms, highlighting the elements of the pathway that are common to both species and those that may be absent in the model organism.
Species Comparison is launched using the Analysis button in the Pathway Browser header bar. In the Species Comparison section, select one of the species in the dropdown list. Click the Go button:

The results are ready to view when analysis results appear (or are updated if already present) in the Pathway Hierarchy.
Clicking on a pathway name launches the Pathway Browser and displays the relevant Pathway Diagram (see example below).
The colour of reaction objects indicates the result of the comparison:
- Yellow indicates that the protein has an inferred equivalent in the comparison species.
- No overlay indicates that inference was not possible. This is always the case for small molecules, DNA and other objects that have no UniProt entry (or did not at the time the pathway was constructed).
- Objects with bands of colour represent complexes or sets containing more than one molecule. The bands of colour reflect the inference success for the molecules within the complex/set.
To view species comparison results for a complex or set hover your mouse over the object and a small blue triangle will appear on its right side. Select this to open the Contextual information Panel.
This reveals a table representing all the proteins involved in the complex/set. Each square in the grid represents one component of the complex/set, coloured as described above.
The species bar at the bottom of the Pathway Diagram (see example above) can be used to turn off species comparison colouring, by unchecking the box.
Refer to the Navigating Pathway Diagrams section for more information on the diagram content.
Tissue Distribution
Traditionally, reactions in Reactome represent events that occur within a single generic human cell. It would, however, be useful to classify reactions into different human tissue types, as to provide an evolving picture of the reactions and pathways in different cell- and tissue-specific environments. We have imported protein expression in different cell/tissue types from the Human Protein Atlas (HPA), overlaid these proteins on Reactome data, and extracted the subset of reactions for that particular cell type. The HPA data reflecting the expression of the protein-coding genes in 44 different human tissues can be visualized through the Analysis tools.

Tissue Distribution is launched using the Analysis button in the Pathway Browser header bar. In the Tissue Distribution section, select the one experimental tissue dataset [HPA (E-PROT-3) - Expression Atlas] in the dropdown list. Once the window refreshes, select the 'Available Tissues' in the left panel and hit the 'Add' button to add tissue expression data to the analysis tool. Press the "Add All' button, if you would like to adjoin all the tissue expression data. Use the 'Remove all' and 'Remove' buttons to delete tissue expression data from the filter list. Once you have selected all the appropriate tissues, click the Go button to start the analysis.

The results are ready to view when analysis results appear (or are updated if already present) in the Pathway Hierarchy and the Overview panel.

Clicking on a pathway name launches the Pathway Browser and displays the relevant Pathway Diagram (see example below).

Objects in the Pathway Diagram are re-coloured according to the numeric values submitted. The colours are based on a scale as represented in a bar on the right-hand side. There are several colour schemes, selected using the Settings pop-out panel on the right side. The scale (on the right side) automatically adjusts to fit the range of values in the dataset.
Objects that were not represented in the input data are not re-coloured.
Objects with bands of colour represent complexes or sets containing more than one molecule. When zoomed out, the colour of the band reflects the average of the values submitted, for molecules represented in the dataset. The size of the band reflects the proportion of molecules that had submitted values. Zoom in to see individual bands, for each molecule that had a submitted value, arranged alphabetically by name. The bands of colour now reflect the values submitted. If multiple columns of values were submitted, representing multiple samples, e.g. time-points or a disease progression, the order of the bands will be the same for each sample.
To view details of the components of a complex or set right click it. This opens a Contextual Information Panel (CIP) (see figure above). This has two tabs - Molecules and Pathways. Molecules show the participating molecules, and if an expression analysis has been performed, their expression values. Pathways identify whether the selected object is present in any other Reactome pathways, with links to the appropriate Pathway Diagrams.
Multiple CIPs can be opened and pinned so they remain visible when other entities are selected.
The browser remembers CIPs that were pinned on the last visit (for up to 5 diagrams).
The Experiment Browser toolbar (bottom left in the figure above) is used to step through the columns of your data, e.g. time-points or disease progression. Move between them by clicking the arrow buttons. The header of the data column (if present) is displayed between the arrows. The Pathway Diagram will re-colour to reflect the new values.
Clicking on the illustration icon (photo-like icon in the top right of the Pathway Browser) displays the relevant Pathway Illustration (see example below).

Getting Started
Pathway Analysis Exercises
This exercise is to check that you understand the results of Pathway Analysis.
On the Home page, open the Pathway Browser. Click on the Analyse Data button. When the submission form appears, in the Analysis Tools section select ‘Click here to paste your data or try example data sets…’
…and click on the UniProt accession list button on the right side.
Your submission page should look like this:

Click Continue. Make sure that Project to human is checked, but Include interactors is not. When the results appear:
- What pathway(s) is (are) most over-represented in this dataset?
- How many IDs match the pathway at the top of the list?
- Roughly what proportion of molecules in the pathway are matched?
- What proportion of reactions are matched?
- Repeat the analysis but this time check the box to Include interactors. Are the results the same? If not, why?
Expression Analysis Exercises
This exercise is to check that you can run and interpret the results of Expression Analysis.
Launch Expression Analysis and load the example dataset. Click GO When the results are displayed, find the pathway DNA Repair,
- How many proteins are in this pathway?
- What proportion of these had expression data?
- What was the average expression at 24h?
- Which subpathway has the highest average expression value at 24h? (Hint: move your mouse pointer over the pathway overview diagram, and look at the scale on the right side).
Species Comparison Exercises
This exercise is to check that you can run and interpret Species Comparison results.
Launch Species Comparison and select the species Danio rerio. When the results are displayed, use the Pathway Hierarchy to Navigate to ‘Hemostasis’, ‘Dissolution of fibrin clot’.
- Find PLAT(36-562) top-right of the diagram - what colour is it and why?
- Find HRG - what colour is it and why?
- Why is Zn2+ (upper left) uncoloured?
More information
Molecular Interaction Overlay
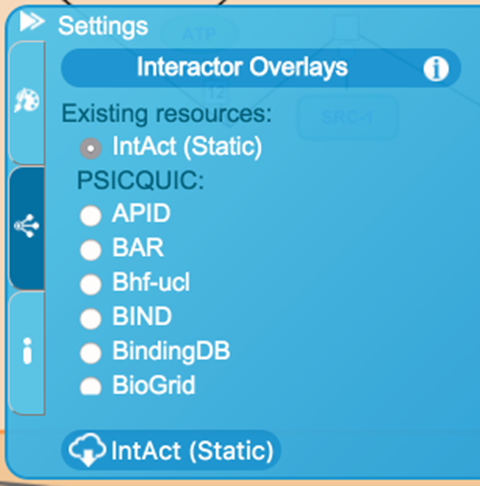
If the user is interested in analyzing the data with interactors from other sources (like IntAct), the ‘Include Interactors’ options must be selected in the ‘Analyze Data’ section. Once in the pathway diagram, the Molecular Interaction (MI) overlay allows protein-protein or protein-small molecule interactions to be superimposed onto the pathway diagram. The source depends on the currently selected interaction database. The default interaction database is IntAct (Static), which provides fast access to a quarterly updated and locally-hosted version of IntAct data. Access to the IntAct-hosted dataset and other PSICQUIC sources of interaction data (protein-protein and protein-small molecule) can be selected using the ‘PSICQUIC’ feature of the Interactor Overlays tab within the Settings panel in the middle-right of the Pathway diagram. A list allows selection of the source of interactors. This is automatically populated by querying the PSICQUIC Registry. If a new database is selected while interactors are displayed on the pathway diagram, the proteins represented by those entities will be used as queries in the new database and the display will automatically update. An ‘i’ (‘information’) button to the top right of the Interactor Overlays tab provides a quick tip about using the MI overlay. Selecting either ‘Cyan’ or ‘Teal’ in the ‘Interactors Colour Profile:’ drop-down menu within the ‘Colour Palette’ feature of the Settings panel will change the interactor colour.
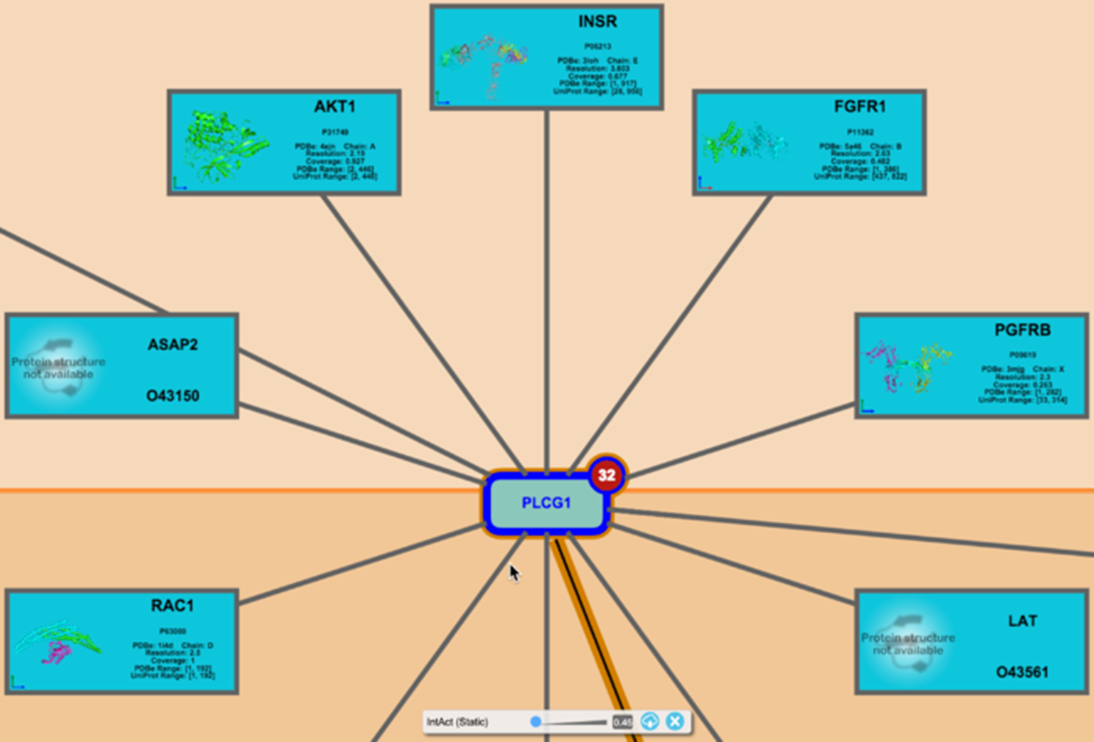
Once a pathway diagram is displayed in the viewport, a small red circle with a white-lettered number in the top right corner of the entity will automatically appear for individual protein and chemical entities that have interactors. The number represents the number of known interactors for the given protein. Pressing the red circle with the cursor will display the interactors. A maximum of 10 interactors is displayed as a ring of blue-bordered boxes (protein interactors) or green-bordered ovals (small molecule interactors) connected by black lines to the selected protein. If the same interactor is connected to more than one entity it is re-used, i.e. connected to all the selected entities in the diagram. Furthermore, if the interactor is a protein or small molecule entity that pre-exists within the pathway diagram, a black line connects the two entities. Pressing the red circle a second time will remove the interactors from the pathway diagram. If an entity interacts with itself, a looping arrow is shown.

A number of actions provide additional information about the interactor and its relationship to the protein entity. These include:
- Hover the mouse pointer over a protein interactor to reveal a tool-tip containing its name and UniProt identifier.
- Click an interactor to open its database entry in a new window.
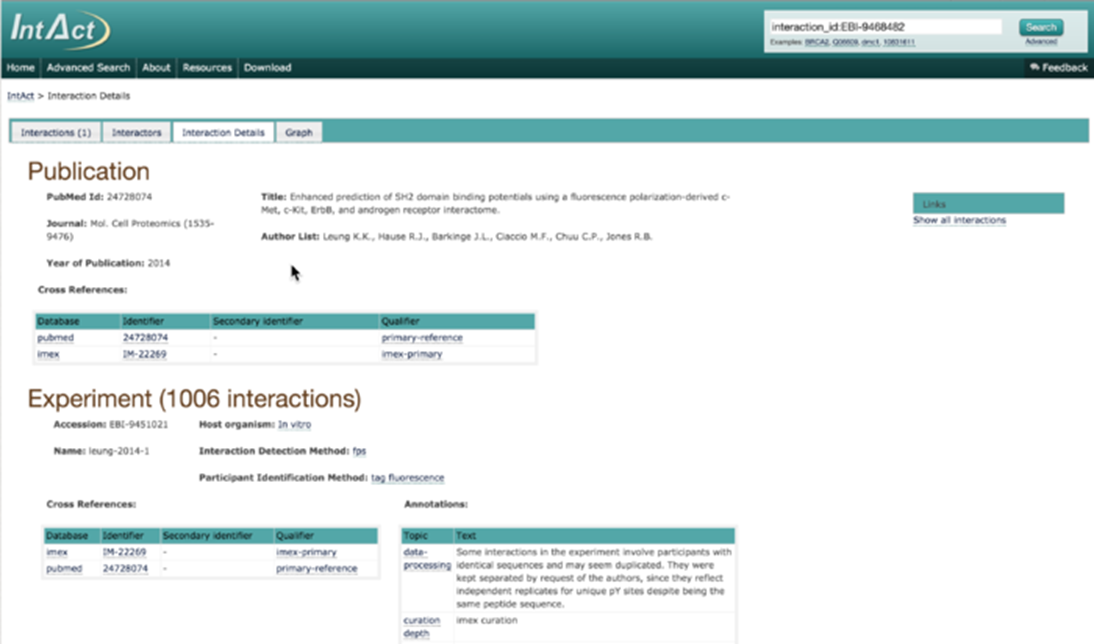
- Click the line that connects the interactor to the pathway molecule to open details of the interaction from the source database, in a new window.
- Right-click a pathway object, or select the blue triangle that appears on the right side when hovering the mouse pointer over it, to open a pop-up panel (the Contextual Information Panel). Select the Interactors (bottom) tab to display a table of all interactors for the selected object. This table is scrollable and provides additional information about the interactors. Click the ‘Interactor’ name or accession identifier to connect to UniProt or the interaction source database, respectively. Click the ‘id’ button to toggle the display of either the interactor name or its database identifier. Click the pin button to fix the open table in position on the pathway diagram. Click the ‘X’ in the top right corner to close the table view.
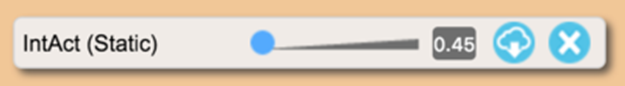
Interactions from the IntAct database have confidence scores that are generated as the cumulated sum of a weighted score that depends on the interaction detection method and the number of observations. The default lower threshold is 0.45. Interactions with a confidence level equal to or above this are shown. Move the slider bar in the Molecular Overlay toolbar (light grey bar with dark grey slider found at the bottom of the pathway diagram) to the right to raise the confidence level threshold. Interactors below the displayed confidence level will progressively disappear. Move the slider to the left and the interactors will reappear. Click the ‘X’ in the Molecular Overlay toolbar to hide it.
Zooming, either by using the controls in the bottom right corner of the Pathway Diagram or the mouse scroll wheel, increases the size of all objects displayed in the pathway diagram including interactors. When a sufficient size is reached, the crystal structure of proteins or chemical structure of small molecules will appear in the interactor object, if available.
The details of every interactor for every protein in the displayed pathway can be downloaded as a tab-delimited file by clicking the ‘Cloud’ button on the Molecular Overlay toolbar or from the Interactor Overlays tab in the Settings panel.
Molecular Interaction Overlay Exercises
This exercise is to check that you can use and interpret Molecular Interaction Overlays
Open the Pathway Diagram for Netrin-1 Signaling.
- Find the protein NEO1 (top left of the cytosol). How many interactors does it have?
- What is the confidence score for the interaction between NEO1 and GD3? How many times has this interaction been documented? Hint: This detail is not in Reactome.
- Find the protein PTPN11 (below and to the right of NEO1). How many interactors does it have? Display interactors for this protein. How many are there? Can you get a list of all of them?
- What is the easiest way to remove interactors?
